.png?width=970&height=250&name=Untitled%20design%20(9).png)
Data Mapping: A Proactive Approach for Rapid Integration of MES and ERP
Manufacturing today is a complex orchestration of systems, processes, suppliers and people,...
.webp)
The days of standing next to a process with a stopwatch to calculate cycle times are now a distant nightmare. Industry 4.0 has driven innovations in advanced Manufacturing Execution Systems (MES) making data available only a few clicks away. Cycle times, scrap, yields, and downtimes are now calculated in real time giving process owners more time to be engineers and less time being data gatherers.
With key production data collected, Overall Equipment Effectiveness (OEE) calculations are no longer cumbersome to report on. OEE is an important tool in the Six Sigma arsenal to diagnose utilization issues on the factory floor and thus driving continuous improvement efforts.
OEE has long been the standard to measure a factory’s productivity. Manufacturers who utilize OEE metrics see great returns in production efficiency and effectiveness.

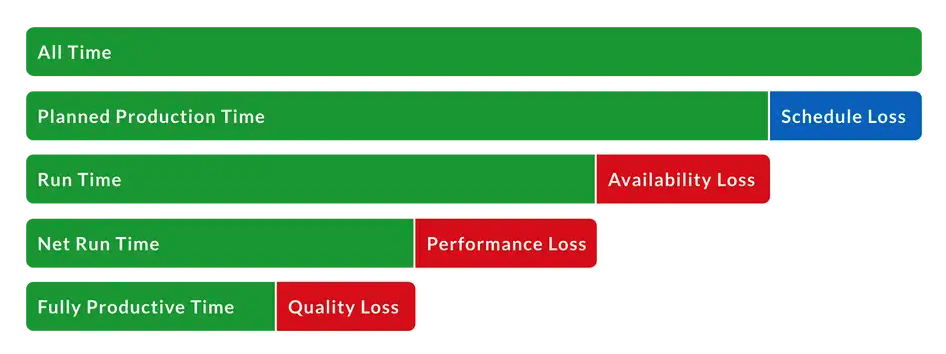
The three components of OEE are availability, performance, and quality. All three metrics must be considered when evaluating overall equipment effectiveness, as each component contributes to the overall performance of a process.
The ratio of Run Time and Planned Production Time (scheduled time). Takes into account any planned and unplanned production stops. A score of 100% means the process is always running during planned production time.
Examples of Availability Loss include: Machine downtime caused by failure and unplanned maintenance, material supply issues and changeover time.
The ratio of Net Run Time to Run Time. Takes into account slow process cycles and small stops. A score of 100% means the process is running as fast as possible.
Examples of Performance Loss include: Operator or equipment reduced cycle time, waiting for the next part to arrive (increased idle time).
The ratio of Fully Productive Time to Net Run Time. Takes into account process defects and reduced yield.
Examples of Quality Loss include: Scrapped and reworked parts.
OEE = Availability x Performance x Quality
The categories below will aid in determining the source of loss for each OEE component and help improve a factories overall utilization.
OEE gives manufacturers full visibility of their factories' performance enabling them to gain important insights and make efficiency improvements.
Two other metrics that can also aid manufacturers to improve productivity are OOE and TEEP.
Overall Operations Effectiveness (OOE): Very similar to OEE calculator however the Availability metric is defined differently. OOE takes into account total unscheduled time (plus scheduled time), versus OEE which only accounts for scheduled time.
OOE = Availability (for OOE) x Performance x Quality
Total Effective Equipment Performance) TEEP: Measures productivity for ‘All Time’. For example if production in a 24hr day is only 2x8hr shifts; Utilization = 16/24 = 66.6%. If TEEP is 100% the manufacturer is yielding perfect production 24hrs a day.
Utilization = Schedule Production Time / All Time
TEEP = OEE x Utilization
There are many software tools available to collect and analyze OEE data. Some tools are standalone products and others are integrated into larger platforms. Today's advanced Manufacturing Execution Systems (MES) often provide some type of OEE reporting.
An MES system that is fully integrated with a factory has all data available to easily calculate and report OEE metrics. The advantage of an MES platform with OEE capabilities is that all data collection is automated and factory performance is visible at any given time.
MES provides the digital backbone for Industry 4.0 and the Intelligent Enterprise.
Intraratio can help you discover the power of MES and yield management systems for your manufacturing process. Arrange now to speak with an MES expert who can guide you through the ins and outs of customizing an advanced solution for your operation.

3 Things To Think About When Choosing Between an ERP or MES System - If you are trying to decide between an MES or ERP solution, you will want to provide answers to the following questions before making your final choice.
3 Key Differences Between ERP and MES Systems - The following are three crucial differences between Enterprise Resource Planning (ERP) and Manufacturing Execution Systems (MES).
Eliminate Manual Data Collection in Manufacturing - Many manufacturers, realizing the inefficiencies of paper, are making steps toward digitization. Learn with us what you need to evaluate when going digital.