.png?width=970&height=250&name=Untitled%20design%20(9).png)
Eliminate Manual Data Collection in Manufacturing
One of the biggest pushes for the digitization of manufacturing processes is the elimination of...
Manufacturing is one of the most important aspects of the economy. It is responsible for creating jobs, producing goods, and maintaining a high level of innovation. In order to maintain a strong manufacturing sector, it is important to track the 6 M'sBy tracking these factors, manufacturers can make sure they are keeping up with the latest technology and trends.
In this blog post, we will explore each of the 6 M's in depth and discuss how they impact manufacturing, we will also take a look at the 5 steps of the DMAIC process (Define, measure, analyze, improve, and control).

With rising labor and material costs, manufacturers all over the world need to continuously improve their manufacturing processes to stay ahead of the competition and keep costs low. In the Industry 4.0 Era manufacturers are increasing their capability to capture data from many sources. Manufacturers are utilizing their data to solve complex issues in production. Many have adopted the DMAIC quality improvement system to drive critical quality improving projects.
One of the more prominent manufacturing issues that consume immense amounts of cost and time is ‘product scrap’. Determining the ‘Root Cause’ of product scrap can be a very difficult task for any organization to fully solve.
Fortunately with the DMAIC method determining the root cause can be accomplished in 5 straight forward steps.
Define the problem, improvement activity, opportunity for improvement, the project goals, and customer requirements
Measure process performance
Analyze the process to determine root causes of variation and poor performance
Improve process performance by addressing and eliminating the root causes
Control the improved process and future process performance
Let's take a deeper dive in the Analyze step, this is the process where we put on our detective hat and brainstorm any potential scrap root causes. There are many methods to complete the Analyze step but what it all boils down to is data mining and analysis.
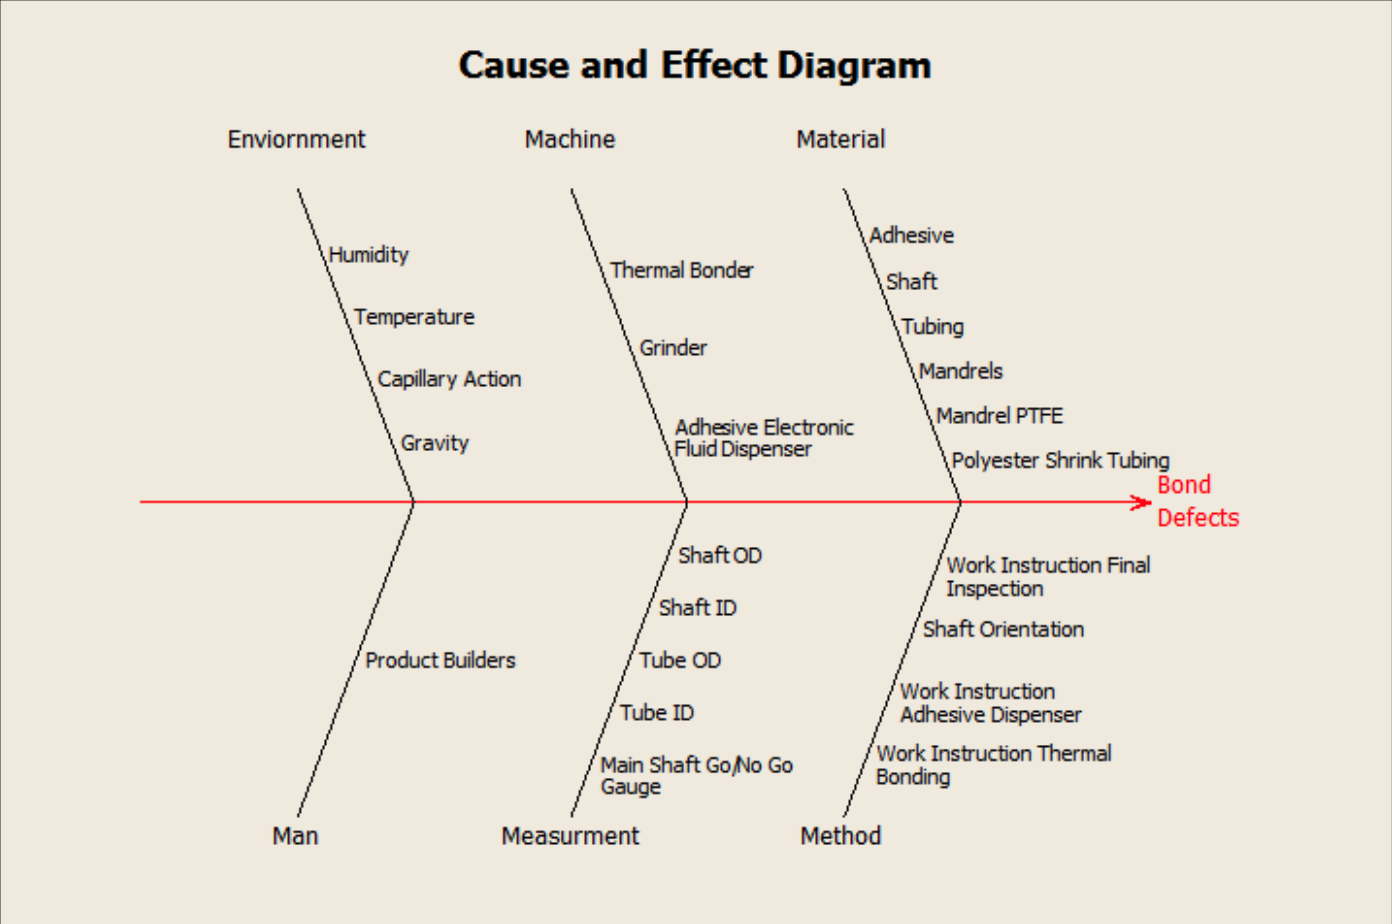
The data mining process starts by generating a fishbone diagram also known as a cause-and-effect diagram. We represent the sources of root cause into the 6M’s of manufacturing. Each branch of the fishbone diagram is one of the 6M’s.
Manpower: The people in your process.
Machine: Machines and tools that you need to produce an output or deliver a service.
Material: The raw materials, consumables, or assemblies that you need to produce the output or deliver the service.
Method: The process steps you need to produce an output or deliver a service.
Measurement: Data, KPIs, inspection results and any other measures that you take of the process inputs, transformation process, and process outputs.
Mother Nature: Environmental conditions both controllable or random that you have both internal and external to your process.
Below is an example of a completed fish bone diagram for scrap caused by bond defects. An engineer or team of engineers recorded what they thought could be a potential cause for bond defects in each of the 6M’s. Now that the fish bone diagram has been completed data needs to be gathered for analysis to determine the true root cause of bond defects.
Gathering the data behind the 6Ms can be a lengthy process without the right infrastructure in place. Data can be collected and stored in various locations. Some sources of data may include machines, legacy software, paper travelers, spreadsheets, and even post-it notes. Tracking and analyzing all this data could take hours or even days to complete. Establishing a robust data infrastructure can alleviate the data collection step so engineers can focus on the analysis step.
With the right Manufacturing Execution System (MES) installed on the production line, data from all the 6M’s can be seamlessly collected.
Let's look at the 6M’s again but from a data point of view.
Now that the data is defined and collected from each of the 6M’s, engineers can begin their analysis to look for potential root causes. Analysis techniques may include outlier detection, correlations, or regression plots. One may look for an outlier in a test result performed by a specific operator or a spike in temperature caused by a malfunctioning oven. Finding outliers or correlations in the data is the first step to pinpoint the root cause.
Analyzing all the data available from the 6Ms can be very time-consuming. If one has no idea where a root cause can be found all the data must be analyzed. To further improve this process AI and machine learning tools can be implemented to automate all the data processing. Deploying machine learning models into production can find outliers from any data produced in the entire factory. What once took hours of data exploration now takes seconds.
The manufacturing sector is constantly changing, Industry 4.0 introduces new technologies every day to improve quality, performance and costs. However the quality improvement fundamentals and methodologies haven't changed too much in the past 50 years. Combining emerging technologies such as AI and machine learning with proven quality improving methodologies can yield limitless possibilities in production.